Highlights
Manchester-Nashua took the crown as the hottest US market again in January. This is the 18th time Manchester-Nashua has taken the top spot in the last 2 years.
Realtor.com’s Market Hotness rankings take into account two aspects of the housing market: 1) market demand, as measured by unique views per property on Realtor.com, and 2) the pace of the market as measured by the number of days a listing remains active on Realtor.com.
West region markets were absent from the list again this month after returning in December. This is the seventh month in the last 8 that Western markets have been absent from the list. The popularity of Western markets tends to peak in the winter and wane in the warmer months, so their absence on January’s list emphasizes their fall from popularity in favor of more affordable markets.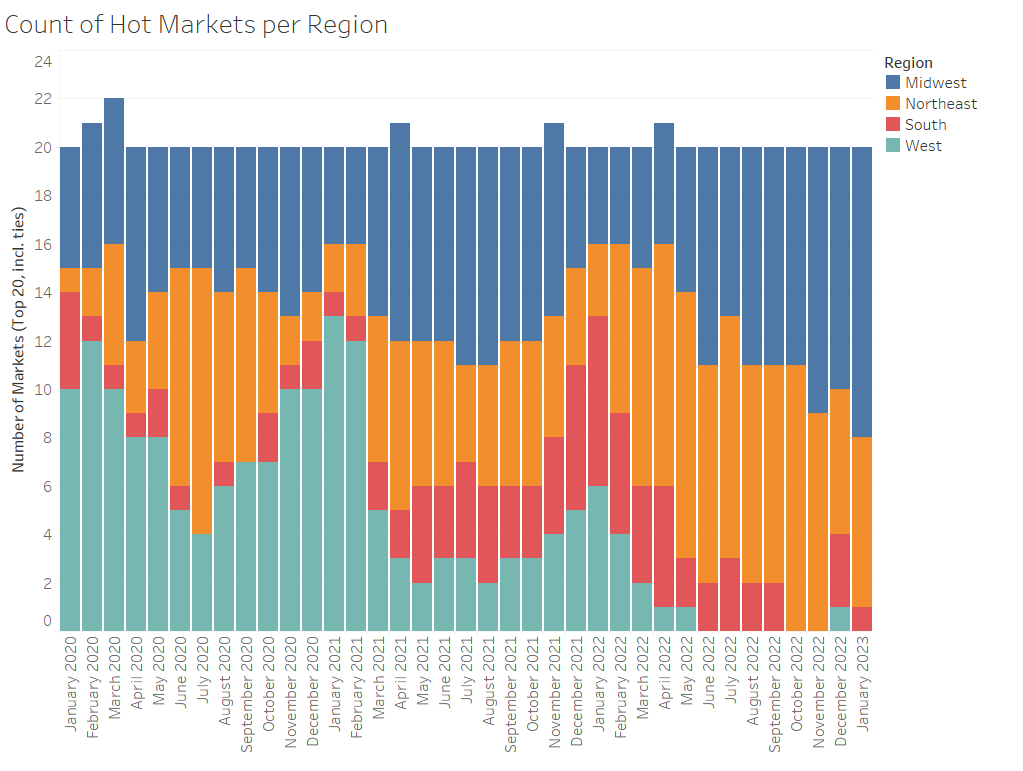
Overall, 15 of January’s hottest markets had median listing prices below the national median. The lowest priced market had a median listing price of $147,000, 63.1% lower than the country’s January median. The average listing price for the 20 hottest markets rose slightly compared to last month due to the inclusion of Boston on this month’s list, which is priced more than $200,000 higher than the next most expensive market. The average listing price of the top 20 markets was $327,000 in January, 18.3% lower than the national median.
Affordable Midwest metros held 12 spots on this month’s list, the most spots in a single month for the region in the data’s history. The average listing price for these midwestern markets was $252,000, 37.0% below the national median. Ohio boasts 5 markets on this month’s list, while Wisconsin is represented by 3, and Illinois by 2. The Midwestern markets on the list were all priced below the national median and garnered an average 1.8 times the number of views as the typical US listing.
The Northeast held 7 spots on January’s list, including several markets that are home to zips from the 2022 Hottest Zip Codes list. The Northeast hottest markets included three locales from Massachusetts and one each from Pennsylvania, Rhode Island, New York and New Hampshire. One of the Massachusetts markets, Worcester, is well-poised for growth, rising to the top of the Top Markets Forecast for 2023. The Manchester-Nashua, Springfield and Worcester metro areas all surround the Boston metro area, which is also on this month’s list, emphasizing the demand to be near this Northeast hub.
Southern markets were represented on January’s list by Roanoke, VA, ranked number 8. This market was priced more than $50,000 below the nation’s median, and garnered nearly double the views of the typical US property, on average.
The states featured in our top 20 list this month are: Illinois, Kansas, Massachusetts, Michigan, New York, New Hampshire, Ohio, Pennsylvania, Rhode Island, Virginia and Wisconsin.
Our Hottest Housing Markets, by design, are the areas where homes sell fastest and have lots of potential buyers checking out each listing, suggesting relatively favorable conditions for sellers. As a group, Realtor.com’s 20 Hottest Housing Markets received 1.5 to 3.0 times the number of viewers per home for sale compared to the national rate. These markets are seeing homes-for-sale move up to 28 days more quickly than the typical property in the United States. Because homes in the hottest markets move fast, shoppers in these areas should be aware of conditions and have their finances in order, including a mortgage pre-approval, so that they can submit an offer quickly if they find a home that is a good fit.
High Demand and Climbing Prices in Hottest Markets
The hottest markets saw median listing viewership an average of 1.9 times higher than was typical in the US in January, emphasizing the sustained popularity of these hot markets relative to the full US market. Homes in the hottest markets attract a greater-than-typical number of home shoppers, with a larger difference between the typical market and the hottest market than was common in the years before the pandemic. The key takeaway for buyers and sellers here is that while national real estate trends are an important context, these trends can drive activity towards or away from certain markets, so local demand may be quite different from national demand.
The median national home price for active listings remained at $400,000 in January, with price growth slowing to 8.1% year-on-year. The vast majority of January’s hottest markets are relatively affordable markets that fall below the national median price, despite seeing price growth that outpaces the national rate. On average, these hot markets have seen prices increase by 21.2% year-over-year, more than doubling the national rate of 8.1%, and the highest level of hot market average price growth in the data’s history. January is the sixth month in a row that the average hottest markets’ price growth climbed beyond US price growth, which has been falling since June. The wide-ranging search for affordability is driving relatively high price growth in otherwise affordable locales, a trend consistent with greater interstate home shopping observed in the Realtor.com Q4-2022 Cross Market Demand Report.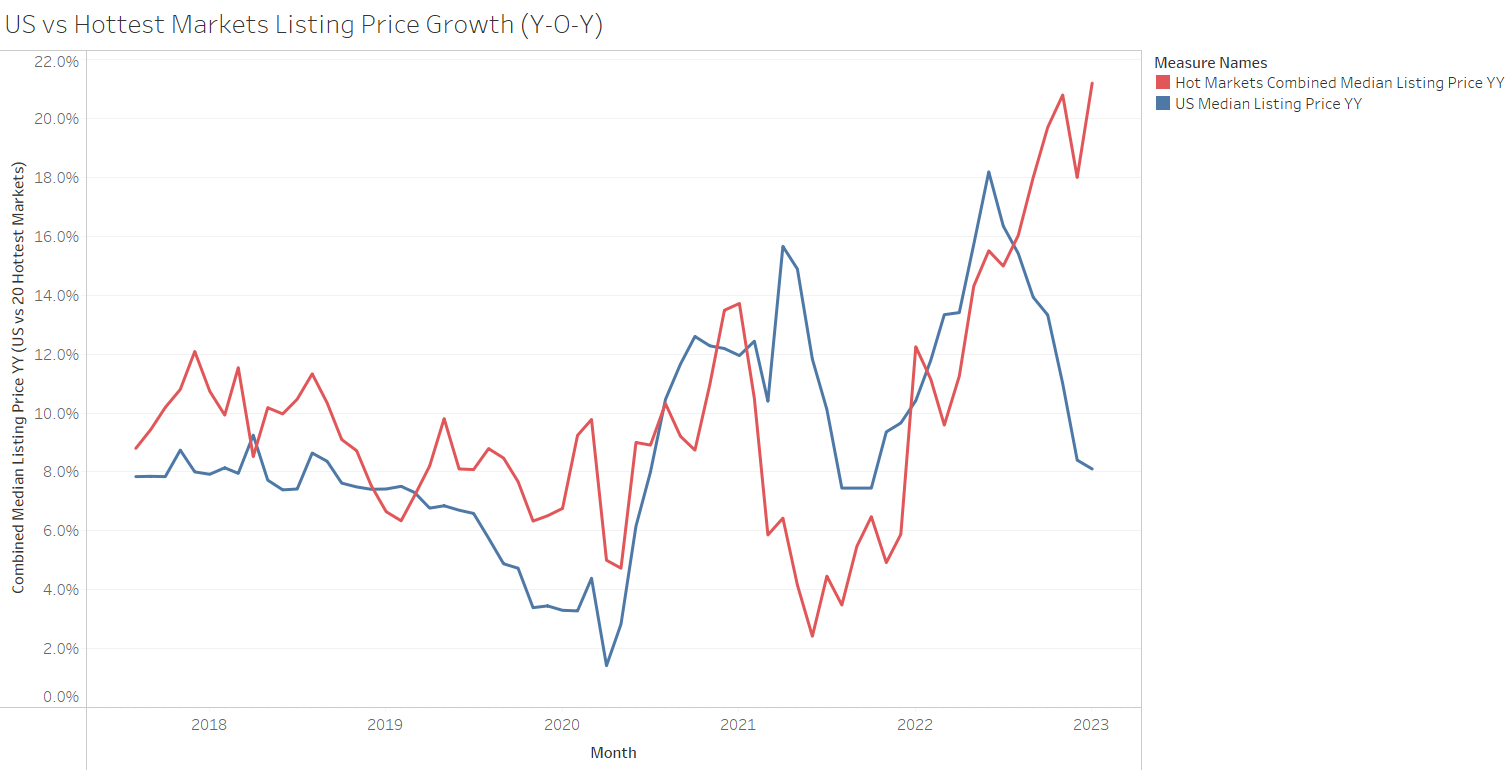
Price per square foot trends mirror the median listing price trends in the hottest markets. Price per square foot growth in this month’s hot markets outpaced US growth, while the price remained below the US median. The average hot market price per square foot was 15.0% below the typical US price in January, though it was up 11.7% compared to last January, outpacing the US’ 8.0% price per square foot growth.
January 2023 – Top 20 Hottest Housing Markets
New Year, Same Top Market
The Manchester-Nashua, N.H. metro area was the country’s hottest market again this month. Homes in Manchester-Nashua were selling in under 51 days in January— eighteen days slower than last year, but more than 3 weeks faster than was typical in the rest of the country. Properties in the metro drew in 3 times as many views per property as the typical home around the United States.
The median listing price of homes in the Manchester-Nashua metro area was $534,000 in January, up a sizable 18.8% year over year, faster than the 8.1% advance in the national median listing price in the same period. This is the highest median listing price for Manchester-Nashua in the data’s history. Price growth is still below the peak growth rate in July 2022 but picked up in January relative to the last four months, possibly indicating a hot spring market ahead. The typical home listing in Manchester is priced 33.5% above the national median price of $400,000, though significantly lower than the nearby Boston area where prices reached over $750,000 in January.
Home prices grew year-over-year in Manchester-Nashua due to both general price growth and a shift in home size. The median for-sale home size in Manchester-Nashua increased by 24.3% compared to January 2022. Controlling for home size, the median listing price per square foot increased by 7.3% compared to the previous year, indicating some of the overall listing price growth is due to the larger homes being sold in this area compared to the previous year.
Larger urban markets cooled off this month, with the largest 40 markets across the country getting 6 ranks cooler, on average, since January 2022.
In line with overall hottest market trends, all five of the most-improved large housing markets were in the Midwest: Milwaukee, WI (+156 spots), Chicago, IL (+146 spots), Minneapolis, MN (+136 spots), Cleveland, OH (+130 spots), and Cincinnati, OH (+125 spots). Most of these markets offered highly sought-after affordability, with listing prices as much as $210,000 below the national median in Cleveland. Milwaukee and Minneapolis, however, were both priced above the national median.
The Milwaukee-Waukesha, WI housing market saw the fastest year-over-year hotness growth in the metro’s data history, earning it the position of fastest-rising large market again in January. In the fourth quarter of 2022, this metro received the most (52.2%) out-of-metro attention from viewers in the nearby Chicago, IL metro area according to Realtor.com Cross-Market Demand data. In January, the Milwaukee area rose 156 spots in hotness rank compared to last year. The metro area clocked in as the 15th hottest metro in the US, the highest January ranking in the data’s history. Homes in Milwaukee typically spent 61 days on the market in January, 15 days fewer than the typical US home. On the demand side, properties in the metro garnered 70.0% more viewers than the typical US property.
On the supply side, the five most-improved large markets saw inventory spend 62 days on the market, roughly the same as last year and an average of 13 days faster than the typical US home. In comparison, the largest 40 markets overall saw properties spend roughly 17 days more time on the market than last year, on average.
Markets Seeing the Largest Jump in Rankings (January 2023)
Note: With the release of its September 2022 housing trends report, Realtor.com® incorporated a new and improved methodology for capturing and reporting housing inventory trends and metrics. The new methodology updates and improves the calculation of time on market and improves handling of duplicate listings. Most areas across the country will see minor changes with a smaller handful of areas seeing larger updates. As a result of these changes, the data released since October 2022 will not be directly comparable with previous data releases (files downloaded before October 2022) and Realtor.com® economics blog posts. However, future data releases, including historical data, will consistently apply the new methodology.
Join our mailing list to receive the latest data and research.
January 2023 Hottest Housing Markets – Realtor.com News
(Visited 2 times, 1 visits today)