4/23/2023 Markets were mixed for the week, as Earnings are coming out. Some Earnings have been better than expected, while others have disappointed.
Probably one more FED Tightening on Wednesday for another 1/4 point higher, pushing Fed Funds to 5%. Then many are hoping that the FED will be finished Tightening, and later the Economy will pick up speed. But the FEAR Index (VIX) under $17 tells us that Dumb Money is now panic Buying call options (expecting a huge rally).
Maybe the Markets have already discounted the Good News of FED Tightening ending soon, and Smart Money will raise CASH. Five of the Swing Trade Positions that we bought hit their Targets this week (see below), and some of the Strongest Leaders are Way Above the Green Line (temporary emotional Buying) with FOMO (Fear of Missing Out).
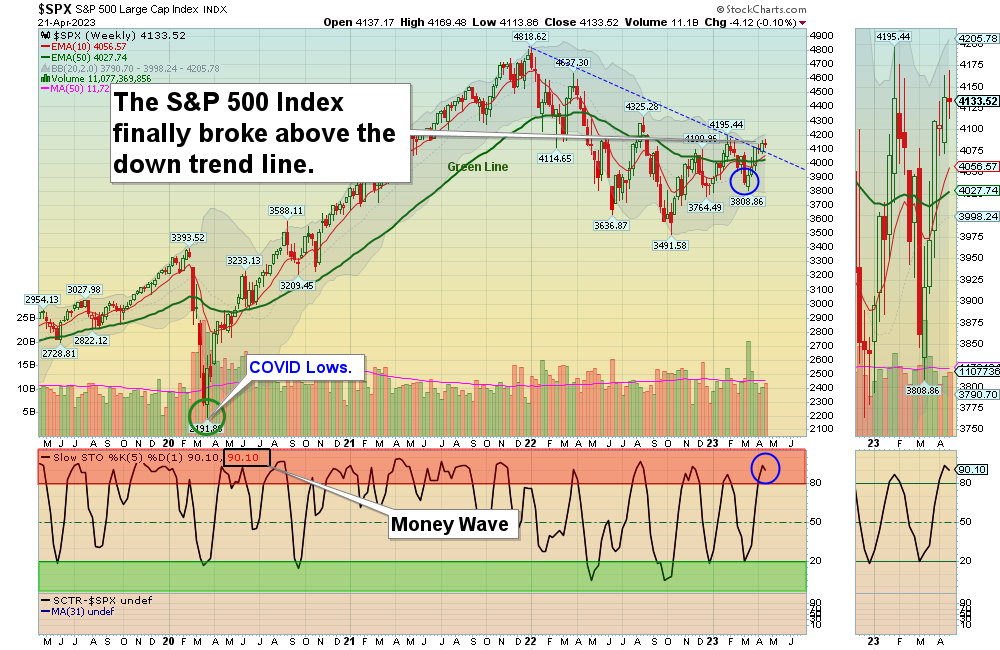
Currently the S&P 500, DOW 30, and NASDAQ 100 are back Above the Green Lines, but are consolidating sideways, the indicating Indecision. So we will have to WAIT for the Markets to break to the upside or downside, and tell us which direction the Money will flow. We will keep Buying strong investments on pull-backs, and not worry about it.
If you continue to Follow the Green Line System, your Money should flow into the Strongest areas and your account value should be able to grow in both Bull and Bear Markets. Follow the MONEY, not the MEDIA.
Completed Swing Trades this week:
ARDX Ardelyx Inc. – Target was Hit for a 6.5% Gain. This trade was not logged.
ETNB 89BIO Inc. – Target was Hit for a 14.2% Gain. This trade was not logged.
FSLR First Solar Inc. – Target was Hit for a 5.6% Gain. This trade was not logged.
HIMS Hims & Hers Health – Target was Hit for a 19.3% Gain.
NVDA NVIDIA Corp. – Target was Hit for a 3% Gain.
______________________________________________________________________________________________
For the week the Dow was down 0.16%, the S&P 500 was down 0.06% and the NASDAQ 100 was down 0.62%. Most of the major Indices have a Relative Strength below 80, so you should currently own the stronger Securities here.
The Inflation Index (CRB) was up 1.55% for the week and is Above the Green Line, indicating Economic Expansion.
Bonds were down 0.65% for the week, and are Below the Green Line, indicating Economic Expansion.
The US DOLLAR was up 0.30% for the week and is Below the Green Line.
Crude Oil was down 5.63% for the week at $77.87 and GOLD was down 1.26% at $1990.50.
We are now doing micro Day Trades on our new Discord site (free), and now have 141 members. Please join for mobile notifications during the day. Other methods of notification have been too Slow. Also, please check our our Live Streaming on YouTube during Market hours.
More action this week on the Day Trading Scrolling Charts, and DAY TRADING CHARTS FOR INDICES & LARGE CAPS.
_____________________________________________________________________________________________
MONEY BUYS SOON:
We are in now in 5 logged Swing Trading Positions for the Short & Medium Term. There are 7 investments on the Short Term Watch List.
Be patient and WAIT for Green Zone Buy Signals!
LONG TERM INVESTMENTS:
Long Term Scrolling Charts (Real Time)
CHWY CHEWY INC. Buy above $52.88 with High Volume with a 3% Trailing Sell Stop Loss below it.
PINS PINTEREST INC. Buy above $29.27 with High Volume with a 3% Trailing Sell Stop Loss below it.
RIOT RIOT BLOCKCHAIN Broke Out above $11.64 with High Volume. Wait for the next Daily Money Wave Buy Signal this week.
SH INVERSE S&P 500 FUND Buy above $17.71 with High Volume with a 3% Trailing Sell Stop Loss below it.
TAL TAL EDUCATION GROUP Buy above $10.45 with High Volume with a 3% Trailing Sell Stop Loss below it.
__________________________________________________________________________________________
My Trading Dashboard
Swing Trading Scrolling Charts
Day Trading Scrolling Charts
Click for Watch Lists
Click for Current Positions
Click for Closed Positions
Updated Top 100 List Apr 1, 2023
Dividend Growth Portfolio
Updated ETF Sector Rotation System
Dogs of the DOW System
Long Term Strategy for IRAs & 401k Plans
CNN Fear & Greed Index
Scrolling Stage Chart Investing Charts
Alert! Market Risk is Medium (YELLOW). The probability of successful Short Term Trades is better, when the % of stocks above the 50-day avg. is below 20.
Tell your Friends about the Green Line, and Help Animals.
________________________________________________________________________________
Vince C. writes” Wow! You bring the service (with Discord) to another level!