In 2023Q1, an average of 59.6% of all Realtor.com listing page views from the top 100 metros went to homes located outside the metropolitan areas where shoppers live, indicating Americans are on the move. This was an increase of 4.1 percentage points from the fourth quarter of 2022 and an increase of 3.3 percentage points year-over-year.
At 66.2% of out-of-metro views, home shoppers from the West outperformed their peers and became the group that are most likely to search for out-of-metro homes. Because the West has consistently had the largest share of home shoppers looking elsewhere, it saw the lowest year-over-year change in out-of-market home searching. On the other hand, Northeastern shoppers saw the highest growth in the first quarter, when the share of out-of-market shopping was 4.6 percentage points higher than the prior year. Greater growth in cross-market activity in the Northeast has elevated the out-of-market shopping share from roughly on par with the Midwest and South in 2020 to a clear second place in 2023. In all four regions, more than half of online shopping traffic went to homes outside of their metro areas. By comparison, only the Western region had this level of outside shopping interest three years ago. 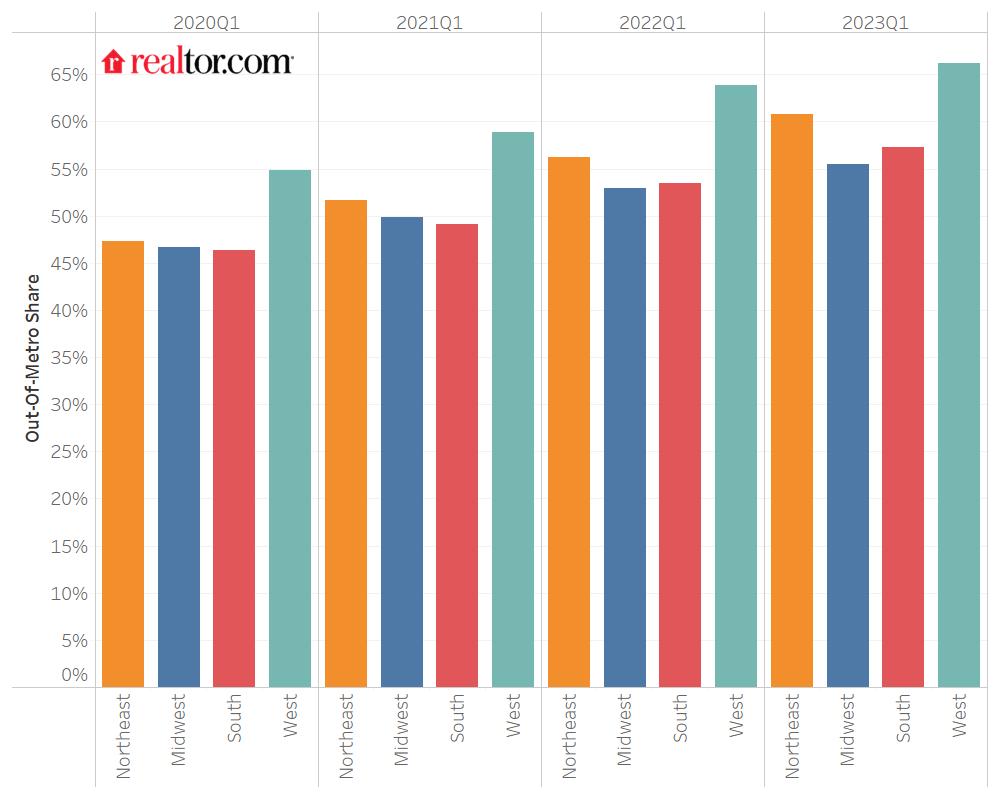
to Other Metros (2023Q1)
to Other Metros (2022Q1)
To celebrate National Homeownership Month in June, we analyze the cross-market data to understand the factors influencing people’s desired locations for homeownership. For each viewer’s metro, we only focus on the traffic towards the top 10 most popular destinations and compare homeownership rates between home metros and destinations.
In the first quarter of 2023, 67.7% of out-of-metro traffic from the top 100 metros went towards metropolitan areas with higher homeownership rates, a 1.1 percentage points increase than the share 12 months ago. The evolving trend suggests that a growing number of shoppers are exploring markets with lower barriers to entry as a means to gain access to homeownership.
Regionally, the share of online traffic going to metros with lower homeownership rates increased in the West and Northeast compared to a year ago.This is despite slight improvements in homeownership rates over the past 12 months. It is not surprising, considering that the homeownership rates in the West (61.9%) and Northeast (62.7%) have been below the national average (66.0%), indicating greater obstacles to homeownership in these markets.
On the other hand, the South experienced a decrease of 2.4 percentage points in its share of traffic to higher homeownership metros, while the Midwest saw an even more significant decline. Since homeownership rates are higher in these regions, the diminishing traffic share indicates that buyers may face more challenging conditions, with fewer options of easily accessible markets to choose from.1 As a result, individuals from the South and Midwest might be forced to enter markets where competition is more intense, thereby exacerbating the difficulties associated with achieving homeownership.
Share of Outbound Views to Metros
with Higher Homeownership(2023Q1)
with Higher Homeownership(2022Q1)
We use REALTORS® affordability scores to understand the impact of affordability in home searching. The score varies between zero and two, with a weighted average score of 0.63 among the top 100 metros in 2023Q1.The higher the score is, the more affordable the housing market is. For each viewer’s metro, we only focus on the traffic towards the top 10 popular destinations and compare affordability scores between home metros and these destinations.
In the first quarter of 2023, 50.3% of out-of-metro traffic from the top 100 metros went towards metropolitan areas with higher affordability scores, 1.4 percentage points higher than a year ago, suggesting an increasing interest in searching for affordability.
Regionally, with an average weighted affordability score as high as 0.87, views from the Midwest to more affordable markets were only 25.2% of outbound views in the first quarter of 2023, the lowest share among the four regions. In addition, the traffic share to more affordable metros was 15.4 percentage points lower than a year ago, suggesting that buyers in the Midwest faced worsening market conditions as there might be fewer more affordable markets available for them to relocate to. In other words, more buyers in the Midwest were forced to compete in more expensive markets, making it more challenging to obtain homeownership. In contrast, the share of traffic towards more affordable markets increased in all three other regions. With an affordability score of 0.44, 63.3% of out-of-metro views from the West went to more affordable metros, an increase of 6.1 percentage points compared to the same time last year. In the Northeast and Southern markets, where the scores were both around 0.64, 61.4% and 45.6% of out-of-market traffic went to more affordable areas.
More Affordable Metros (2023Q1)
More Affordable Metros (2022Q1)
We use the 2022 annual average temperature sourced from National Centers For Environmental Information to understand the impact of one facet of climate in home searching.2 For each viewer’s metro, we only focus on the traffic towards the top 10 popular destinations and compare average temperature between home metros and destinations.
In 2023Q1, 59% of out-of-metro views from the top 100 metros went to markets with warmer climates, 3.0 percentage points higher than a year ago. Preferences for moving to warmer areas are more noticeable in the Midwest (51°F) and Northeast (50°F) where temperatures are cooler. Specifically, 70.8% out-of-market traffic from the Midwest and Northeast, went to warmer regions. The share in the West (57°F) was 49.9%. In contrast, only 48% of traffic from the South went to warmer areas. Interestingly, the West is the only region that saw a decline in traffic to warmer metros, and a minor increase was also seen in the South. One potential reason could be the increasing extreme heat hazard in these areas, which provides another piece of evidence of the impact of climate on moving decisions.
Warmer Metros (2023Q1)
Warmer Metros (2022Q1)
This report analyzes views of for-sale listings on the Realtor.com marketplace in the Top 100 metros between January and March 2023.
The homeownership, affordability score and climate analysis only focus on the top 10 popular destinations for each home metros. The metro-level homeownership rate is sourced from ACS 1-year survey and Housing Vacancies and Homeownership (CPS/HVS) Data. REALTORS® affordability scores is a monthly series calculated by NAR and Realtor.com to examine affordability conditions in different markets. County level temperature data is obtained from National Centers For Environmental Information and then aggregated to the metro level for the purpose of this research.
Subscribe to our mailing list to receive monthly updates and notifications on the latest data and research.
Join our mailing list to receive the latest data and research.
NOAA National Centers for Environmental information, Climate at a Glance: County Mapping, published May 2023, retrieved on May 22, 2023 from https://www.ncei.noaa.gov/access/monitoring/climate-at-a-glance/county/mapping